Bruxel modules
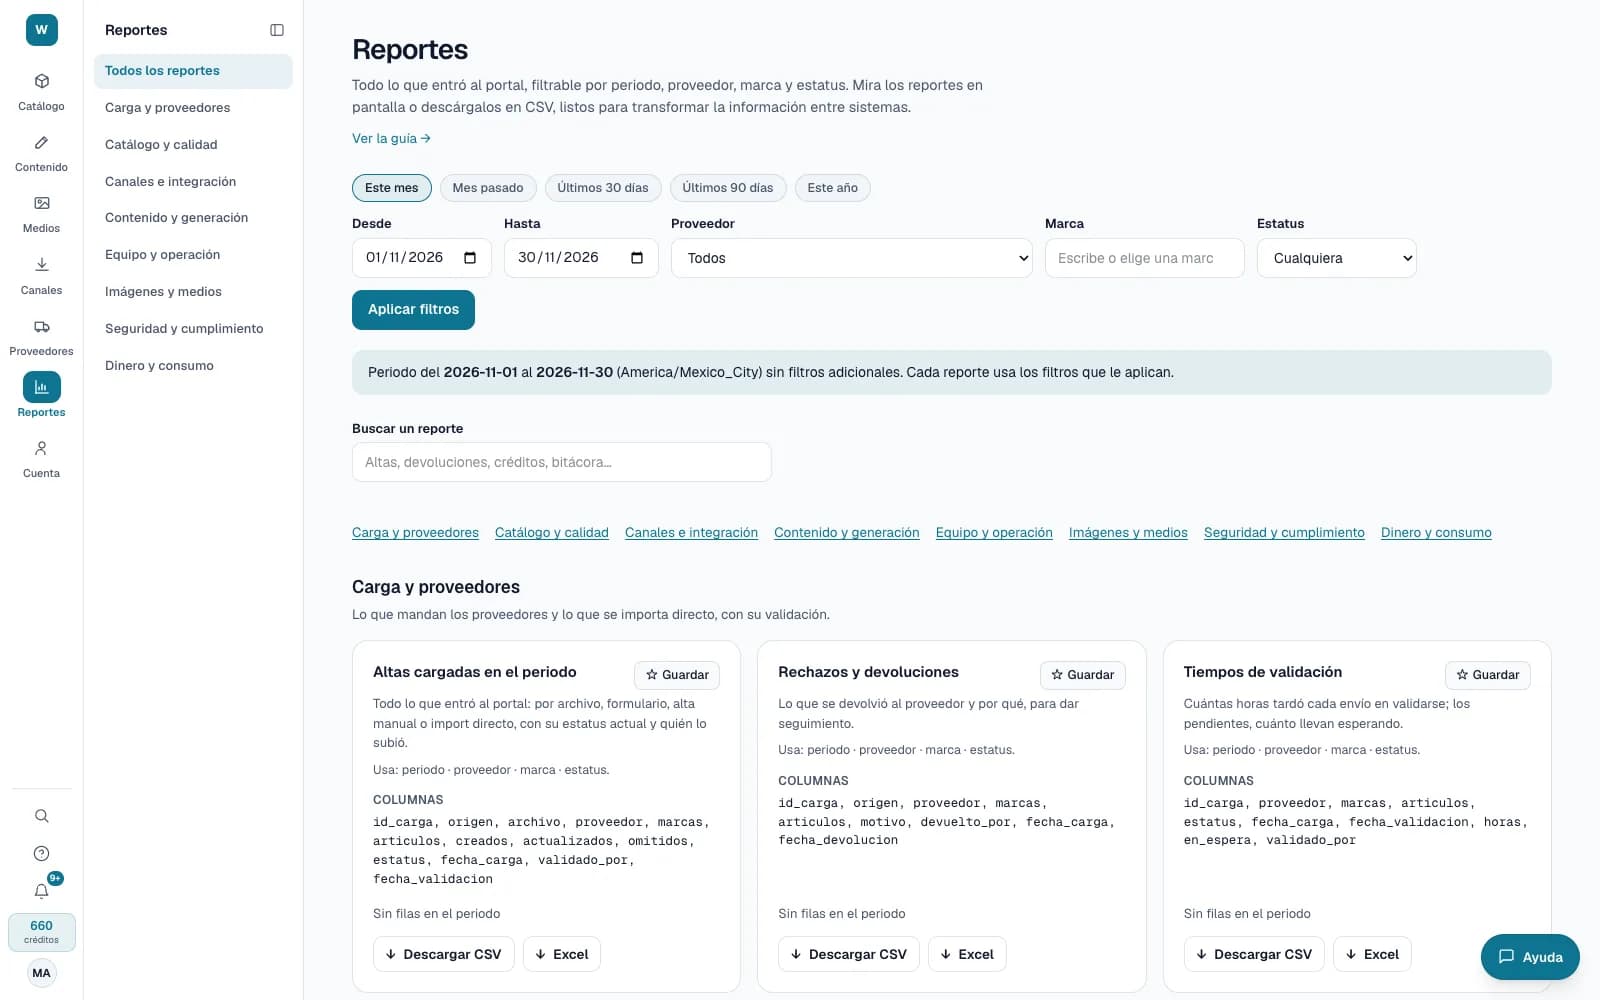
Catalog and operations reports, ready to download
What people ask about the catalog and the operation, in reports you can view on screen and download as CSV or Excel.
What it solves
Building a report by hand at every month-end takes hours and depends on whoever knows how to pull the data. Here each report says what it contains, filters by period, supplier, brand or status and downloads in one click.
- Reports on uploads and suppliers, catalog quality, channels, content, operations, images, security and credit usage.
- Favorites with your filters, which you can share with the organization, and scheduled sends every week or every month to your team.
- Catalog completeness metrics, a quality report in PDF for people who don't use Bruxel, and the list of incomplete products as CSV.
What it looks like
Who it is for
- E-commerce leads who report the catalog's progress every month.
- Teams that take the data to their BI tool or a spreadsheet.
- Anyone who shares the state of the catalog with people who don't use Bruxel.
What it needs
- Reports opens from the Editor role; an Operator sees seven families and an administrator adds money, people, API keys and webhooks.
- Downloading the quality report and the list of incomplete products takes the Operator role or above.
- A period of up to 366 days. An Excel file holds up to 50,000 rows; beyond that, download the CSV.
Its guides
ReportsThe files people ask for to review the catalog and the operation, on one screen: with a period, filters, a search and your favorites.Metrics and the quality reportWhat the Metrics screen measures, how to read your catalog health, and what the PDF report and the list of incomplete products contain.
Read more: Catalog reports in Bruxel: from data to decision without building sheets